

Storyboarding for Change – Visualizing Transformation for Better Alignment and Buy-In
Demonstrating how storyboarding for change can transform a complex organizational transformation into a clear, visual narrative.
Timeline
8-week research and prototyping
Deliverables
Transformation Storyboard
Future-State Blueprint (Powered by Agentforce 360)
Ideation Workshops Formats
KPI-Integrated Visual Blueprint
A cohesive story that ties together
The problem
The journey
The stakeholders
The KPIs
The future-state vision
Description
This case study demonstrates how research from The Agentic Enterprise: Connecting Frontstage & Backstage with Agentforce 360 informed a storyboarding approach to organizational change. By visualizing misalignments, mapping stakeholder perspectives, and integrating KPIs, the storyboard became a collaborative, narrative-driven tool that guided the journey from fragmented processes to a unified, AI-powered enterprise.
Goal
To create a visual, narrative-driven storyboard that:
Communicates the change journey from current-state fragmentation to a future-state, AI-enabled enterprise.
Aligns stakeholders on challenges, turning points, and outcomes.
Integrates measurable KPIs to track the impact of the transformation.
Serves as a collaborative tool for early feedback, rapid iteration, and sustainable adoption of change initiatives.
Research
Mapping Customer Journey Stages
1. Awareness
→ The moment stakeholders realize a need, a pain, or a gap
2. Consideration / Understanding
→ Exploring options, comparing, and diagnosing underlying issues
3. Decision / Commitment
→ Choosing a solution, agreeing on next steps, aligning stakeholders
4. Onboarding / Adoption
→ Transitioning into the new process, learning tools, adapting behavior
5. Engagement / Usage
→ Active use of service, day-to-day work, collaboration across the ecosystem
6. Resolution / Value Realization
→ Outcomes, improvements, KPIs, long-term trust, advocacy
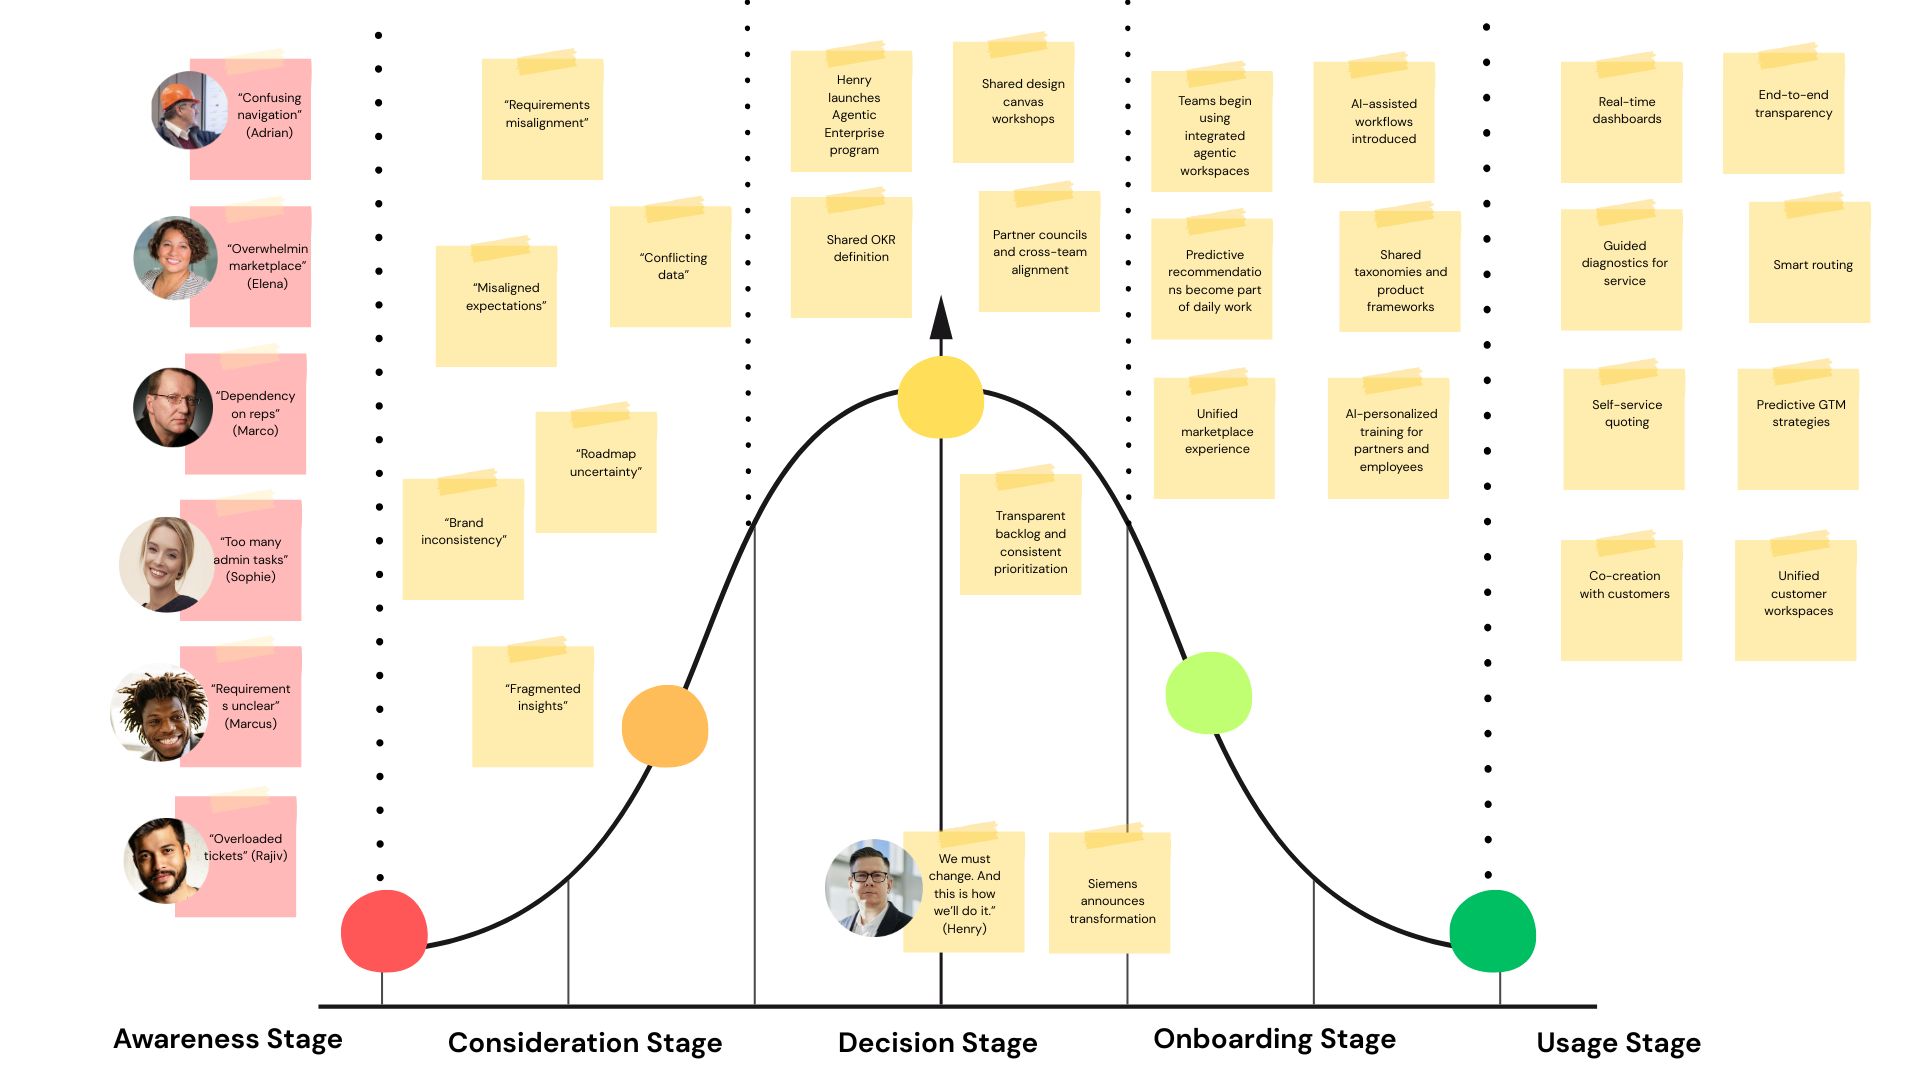
The Story Arcs and Customer Journey Stages
The Storyboarding for Change Approach
Step 1: Define the Core Problem
Research from the Agentic Enterprise study helped pinpoint misalignments and root causes.
Outcome: A shared understanding of the transformation challenge and what success would look like.
Step 2: Create Storyboards
Collected perspectives from stakeholders to create a visual narrative of the change:
Conflict → Challenges → Turning Points → Resolution
Aligned frontstage and backstage perspectives, highlighting dependencies and handoffs.
1) Dr. Adrian Keller — Siemens B2B Customer
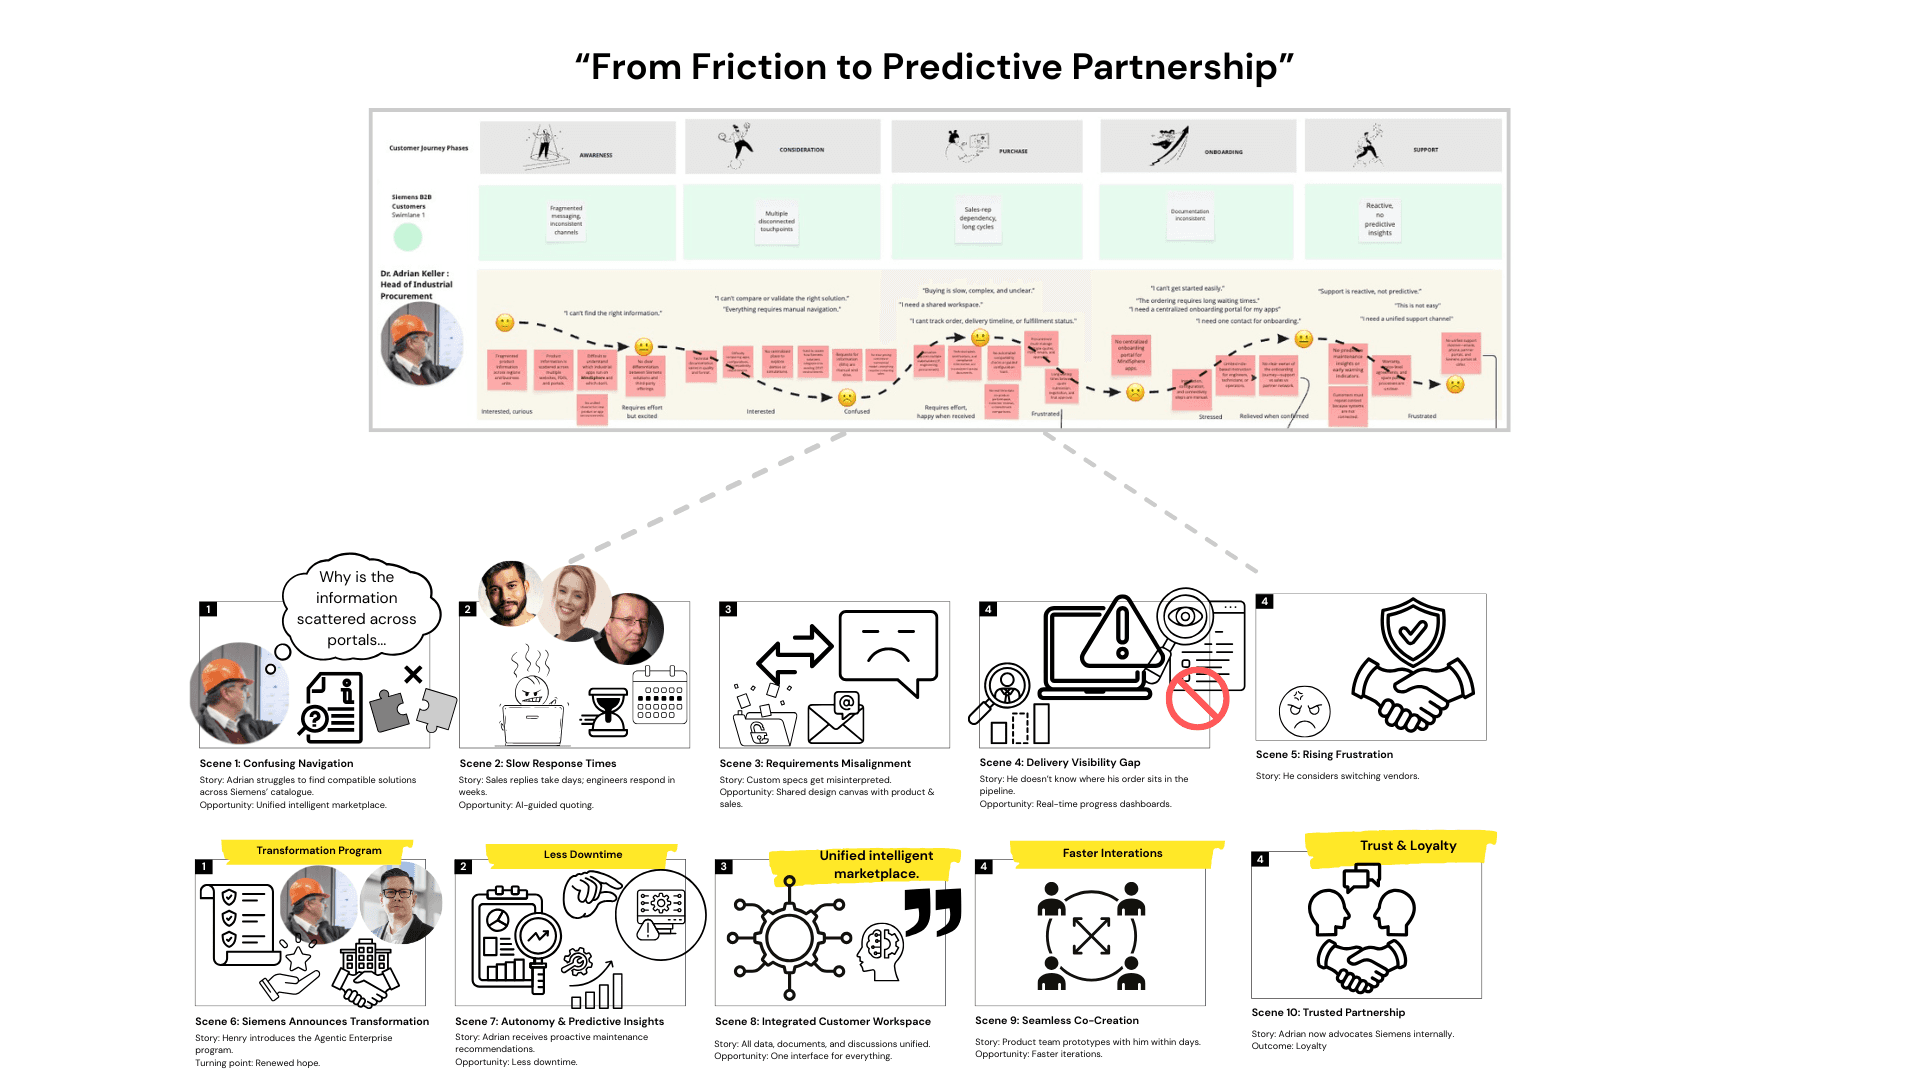
The storyboard scenes link directly to the customer journey stages — across all stakeholders, not only end-customers.
By using a sequence of images or sketches, storyboarding allows teams to visualize the steps from the current state to the desired future state, identify potential roadblocks early, and make cost-effective adjustments before full implementation.
Step 3: Gather Feedback & Refine
Used storyboards as rapid prototypes to test assumptions and clarify misconceptions.
Outcome: A collaborative tool for engagement, early buy-in, and cost-effective adjustments.
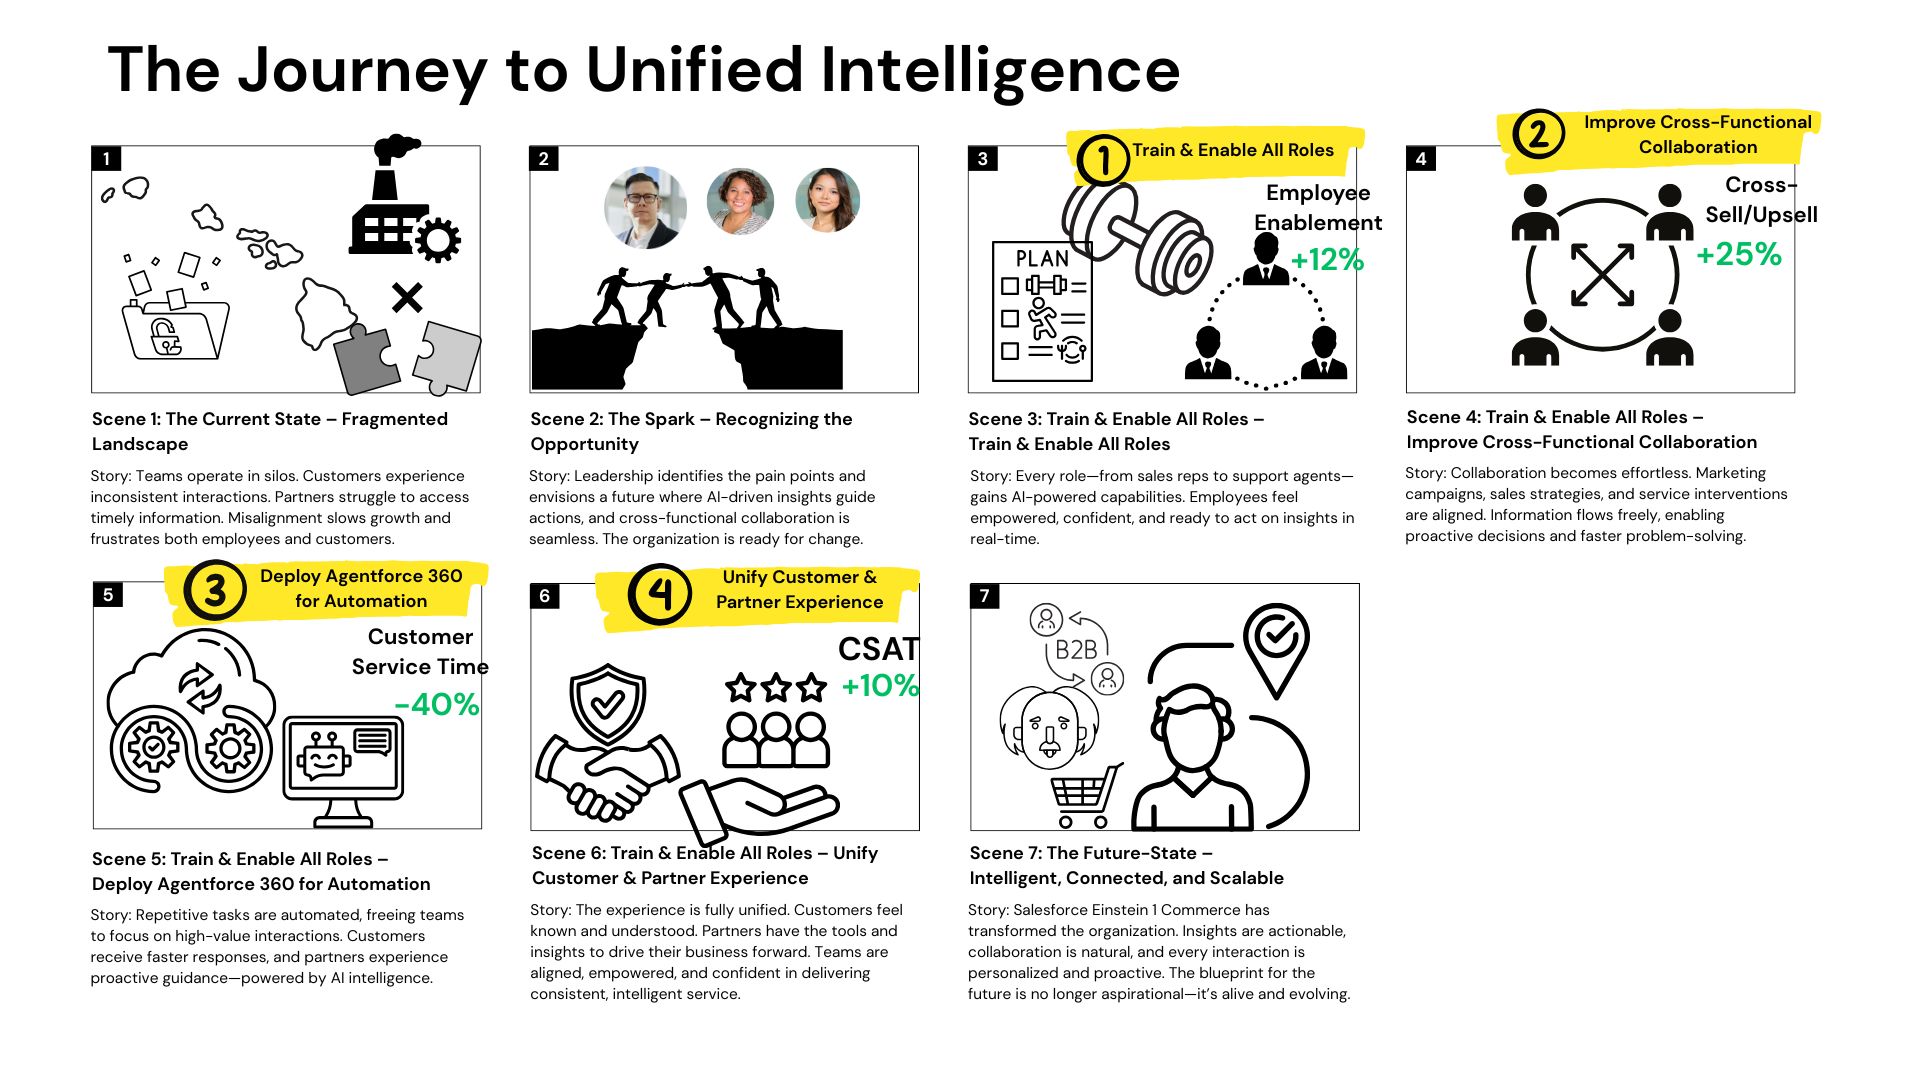
Step 4: Solidify and Sustain the Change
Integrated KPI benchmarks into the storyboard, showing tangible outcomes at each stage:
Customer Service Time ⏱ 60 → 36 hrs (−40%)
CSAT ⭐ 80 → 88% (+10%)
Employee Enablement 👩💻 62 → 70% (+12%)
Cross-Sell / Upsell 📈 20 → 25% (+25%)
Outcome: A living roadmap that communicates progress, reinforces accountability, and supports sustainable adoption.
Storyboarding is more than a planning tool—it’s a communicative and collaborative framework for guiding complex organizational change, bridging frontstage/backstage perspectives, and linking strategic objectives to measurable results.
The storyboard is the lived emotional journey of each stakeholder.
The customer journey is the service lifecycle.
The storyboard scenes map onto each stage of that lifecycle.
Therefore, each story becomes a window into:
pain points
underlying causes
operational friction
emotional states
system dependencies
opportunities for agentic automation
measurable outcomes
We’re not just mapping steps — we’re mapping experiences, which is the foundation of service design.
Key Takeaways
Visual & Narrative Power: Turning complex change into a story makes it easier for stakeholders to understand and engage.
Collaborative Alignment: Storyboards bring together diverse perspectives to create a shared understanding of the journey.
Rapid Feedback Loop: Early visual prototypes help identify gaps and reduce costly adjustments later.
KPI-Driven Outcomes: Integrating metrics into the storyboard ensures the change is measurable and accountable.
Sustainable Change: A storyboard evolves with the initiative, reinforcing the narrative and enabling continuous improvement.